creating location-persistent augmented reality experiences
designer - interaction design, data visualization, visual design, rapid prototyping
The ARway Web Portal helps complement the ARway app, allowing users to manage their accounts, maps, and access detailed statistics and analytics. It also enables the upload of larger files in the content library and provides a platform for users to work on their ARway maps and content via the web rather than the mobile app. My contributions focused on the analytics, accounts page, map information, and content library sections of the web portal.
Analytics
My Account
Content Library
Feedback Section
One of the challenges we faced with the ARway app was the limitation of using a mobile platform for uploading larger files, creating maps, and generating navigation paths. It was especially impractical to transfer large files from a computer to a mobile device just to integrate them into the experience. This process required significant storage space on the phone, in addition to having slow transfer speeds.
One of the key features I developed for the ARway Web Portal was the Content Library. I organized the library into various sections, including images, audio files, 3D models, videos, and Unity packages. These elements can all be integrated into and interacted with within an ARway map. The content library can be seen below in Figures 1 and 2.
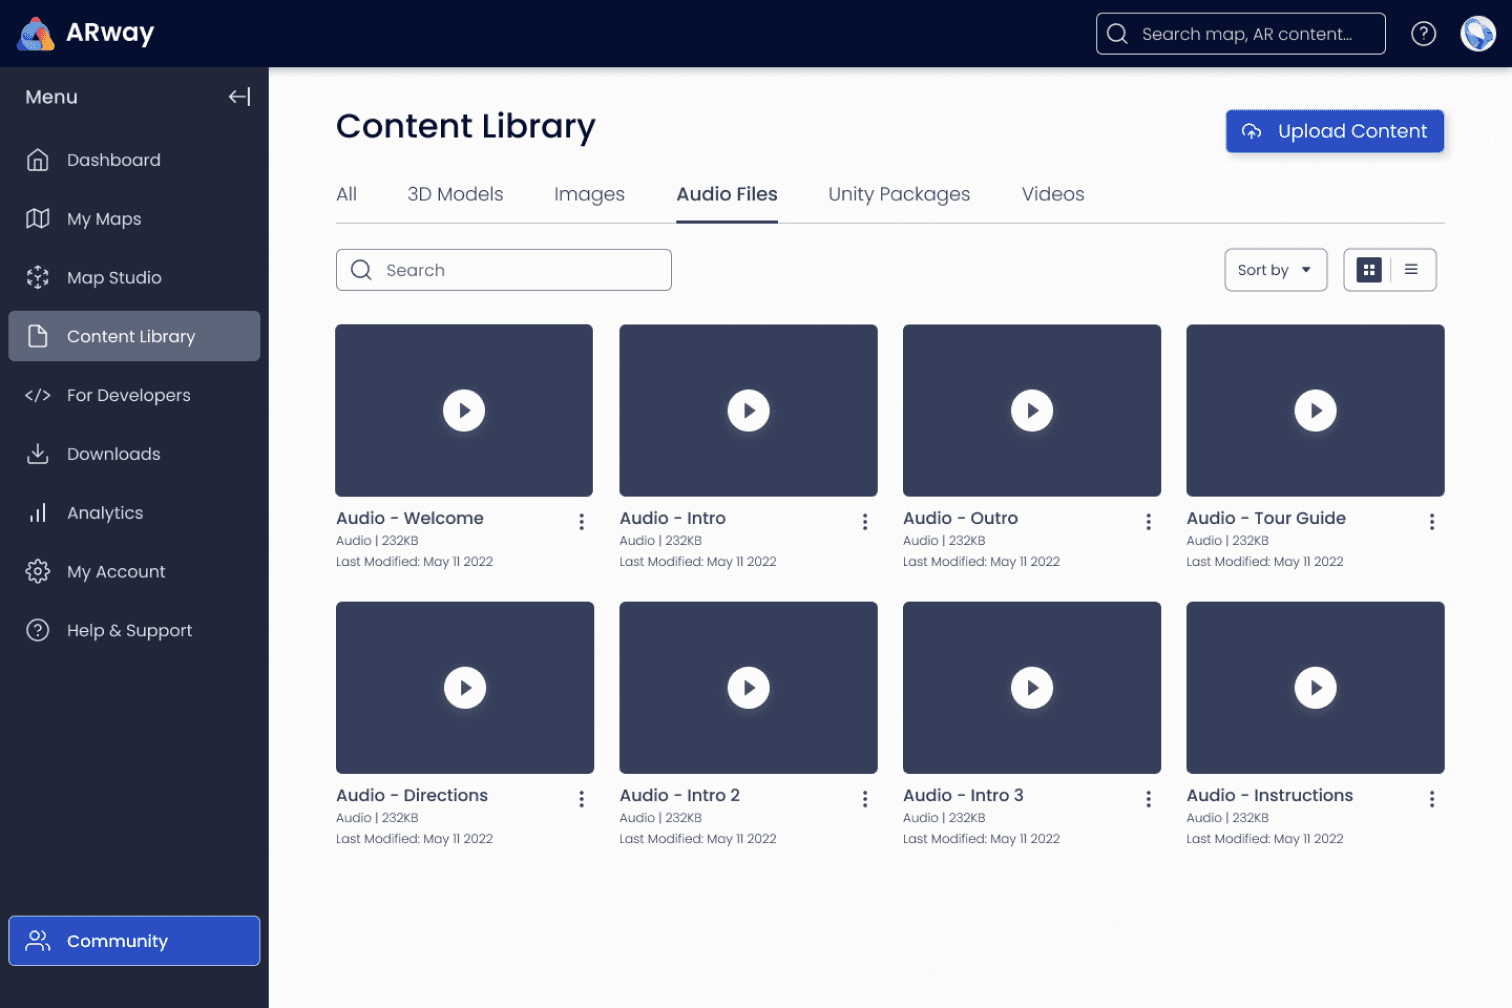
Figure 1: Content Library Audio Files

Figure 2: Uploading to Content Library
analytics integration
We also frequently received feedback from customers expressing uncertainty about the value generated by their maps. They were unsure of user engagement metrics such as the number of users, the usefulness of the map, and areas that were being under-utilized. To help address this, we introduced an analytics feature to ARway. This feature provides detailed insights into map usage, including which areas are most frequently visited, which content is most interacted with, and where users tend to drop off within the map or experience. This information was vital in demonstrating the value of the ARway platform.
I designed some initial mockups of heatmaps shown below in Figure 3 and 4. Highlighting a coloured area will display information about the average time spent in that specific spot or display information about app opens/exits depending on the filter chosen.
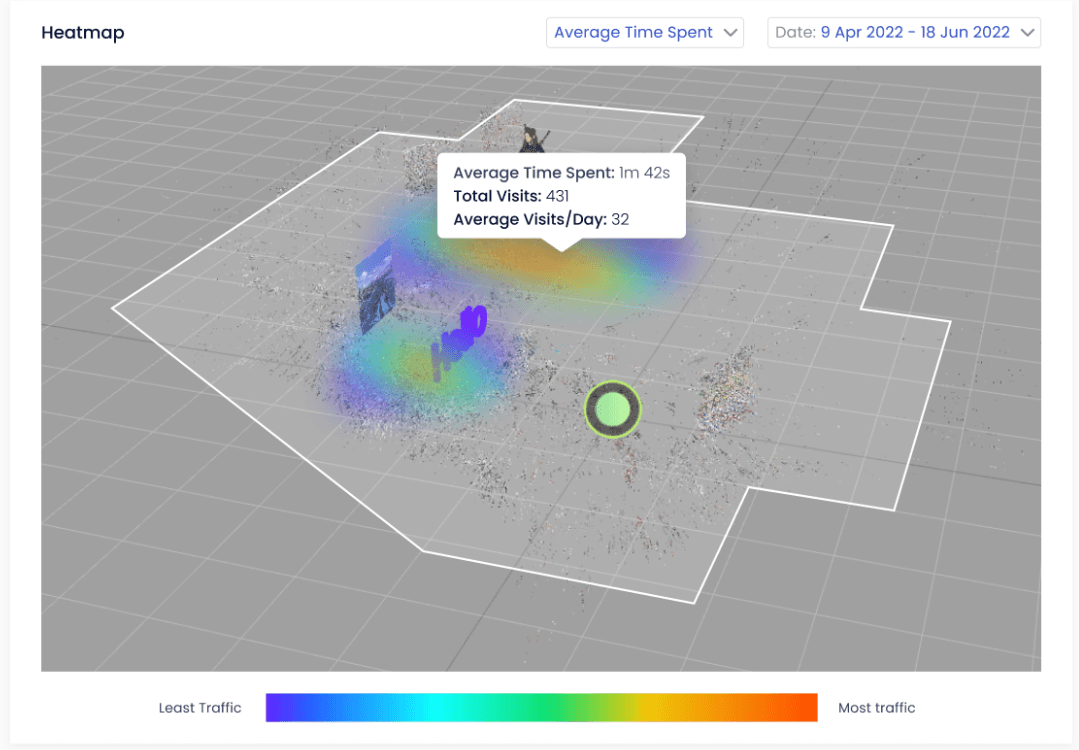
Figure 3: Heatmap (Average TIme Spent)
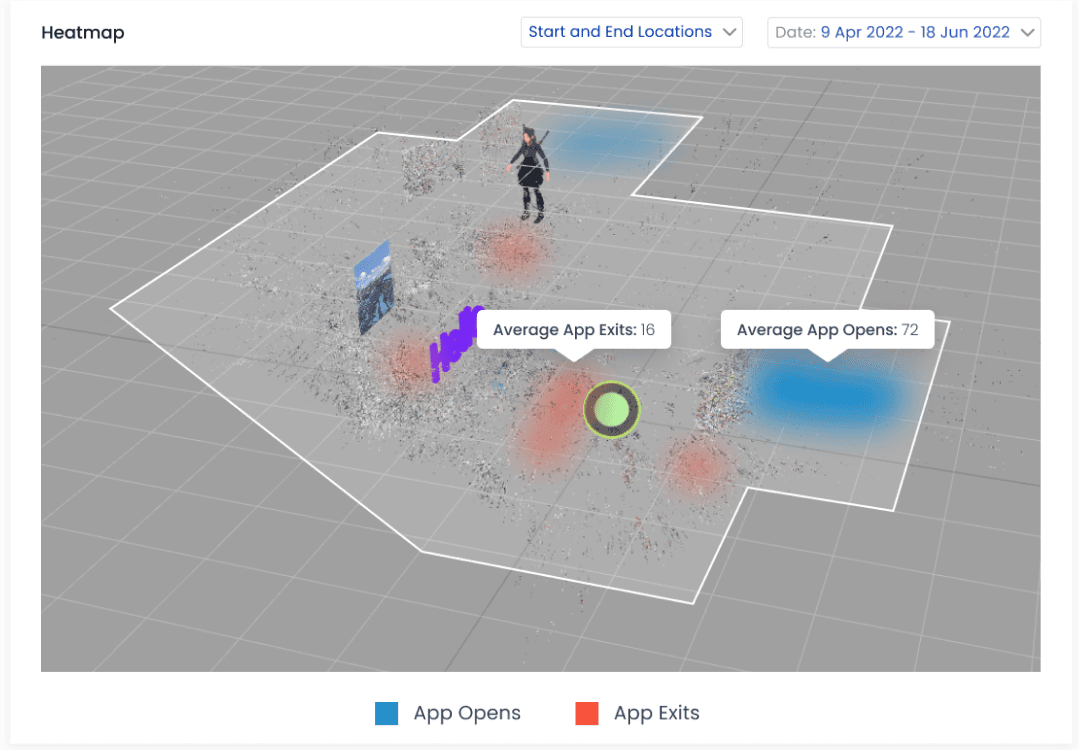
Figure 4: Heatmap (App Opens/Exits)
In addition, I worked on other analytics areas, such as the location analytics illustrated in Figure 5. This data reveals key information about the most navigated areas and popular searches within the map, helping to understand visitor preferences.

Figure 5: Location Analytics
account page
I also worked on the account section shown below in Figures 6, 7, and 8 where users could view their storage limits, manage plans, and handle payment options. This section also allowed users to add team members for collaboration, giving them access to maps and analytics.

Figure 6: Account Section - Plans

Figure 7: Account Section - Billing History

Figure 8: Account Section - Team
key takeaways
One of the key takeaways from this project was the importance of user feedback in shaping design decisions. By listening to ARway customers and addressing their needs with the analytics feature, I saw firsthand how data can improve user satisfaction and engagement. This process helped reinforce the value of empathy in design and understanding the user's perspective can lead to better and more impactful solutions.
© 2024 william dang
made with ceremonial grade matcha and oat milk